Reports
In the Reports section, you can view and download detailed statistics on bot performance. For example, you can use it to see:
- How fast the audience of the bot is growing.
- How users rate bot performance.
- How often users receive an answer to their questions.
- How often the bot cannot solve a problem and transfers dialogs to an agent.
Test session data is not displayed in reports.
Report metrics
You can filter the metrics and select the display period at the top of the screen. By default, it displays all data for the last 2 weeks in day-by-day detail.
User activity
On the Activity tab, you have access to quantitative metrics: users, sessions, messages.
Users
The reports show unique users of the bot.
The Users section displays:
- New users who contact the bot for the first time.
- Returning users who have already interacted with the bot.
- Total number of users.
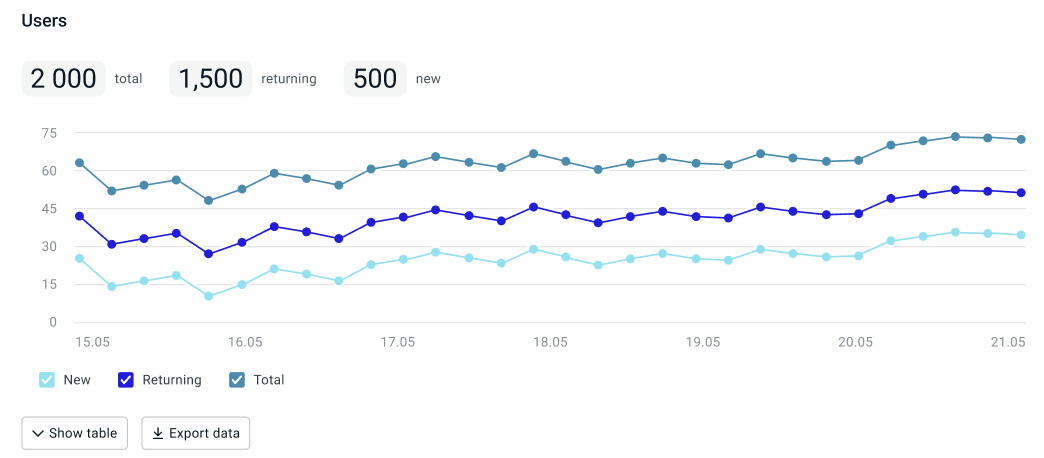
How data on new and returning users is calculated
- New users: in metrics and on the chart, a user is considered new only once.
- Returning users: in metrics, a user is considered as returned only once for the selected period, and on the graph a user is displayed for each day that they communicated with the bot.
For example, a user first messaged the bot on Monday and then contacted the bot again on Tuesday and Wednesday. The metrics for this week will show 1 new user and 1 returning user. In this case, the chart will display 1 new user on Monday, 1 returning user on Tuesday, and 1 returning user on Wednesday.
Sessions
The Sessions section displays:
- Sessions with messages from users over a period.
- Sessions without messages. These are the sessions in which the user did not send messages, for example, in text campaigns. These sessions also include sessions with an empty request and the
/startcommand.
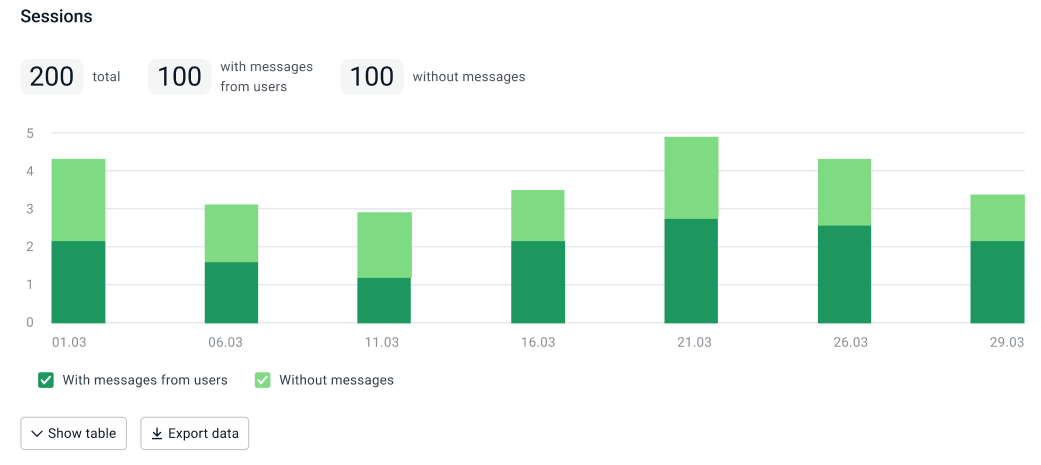
If a session lasted several days, in the metrics, it will be displayed once for the selected period.
At the same time, on the chart, when it is distributed by days, session will be displayed on all days when it was active.
This happens due to the fact that many channels do not automatically limit sessions.
To avoid this behavior, limit sessions in the script by calling the $jsapi.startSession and $jsapi.stopSession methods.
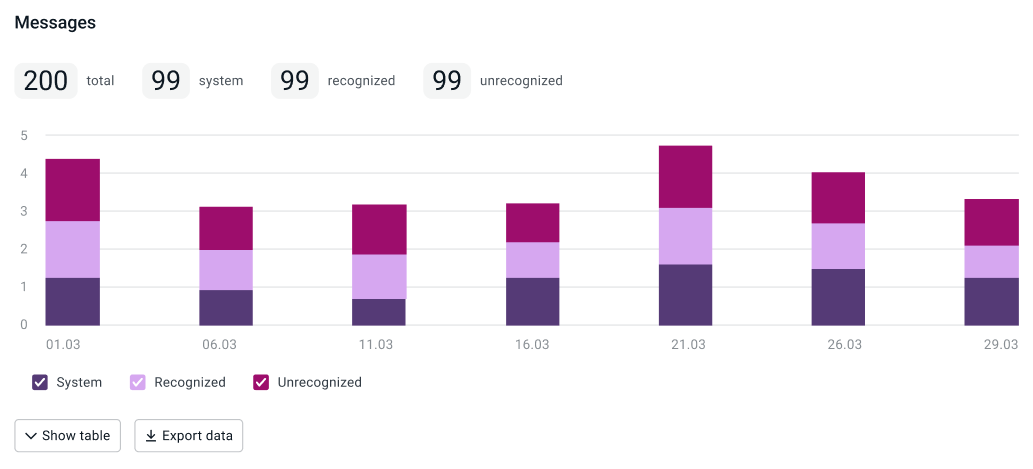
Messages
The Messages section only displays messages from users, including empty requests and messages with the /start command.
For example, messages sent by a bot in text campaigns are not included in the reports,
but those sent by users in response are.
Message types:
- Recognized.
- Unrecognized — unknown phrases that are triggered by the
noMatchsystem event. - System — the
/startcommand and all system events.
Script efficiency
The Efficiency tab contains data on session automation and evaluations from users.
Session automation
The Automation section displays session automation statistics. A session can be considered automated, for example, if the user’s request was resolved without agent assistance.
To collect session automation data, mark up the script using the $analytics.setAutomationStatus method.
The chart displays the number of automated and non-automated sessions and their percentage.
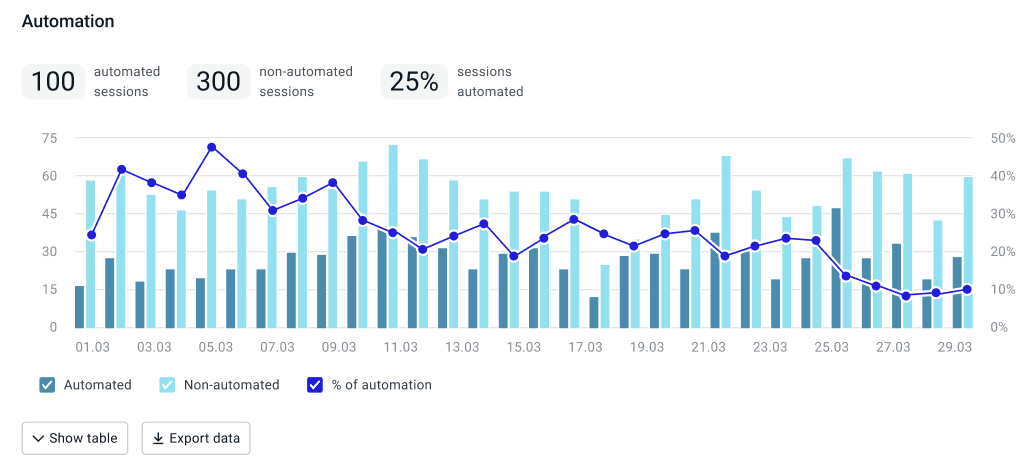
How the percentage of session automation is calculated
Session automation depends on the value with which the $analytics.setAutomationStatus method was called at the end of the session: true or false.
Only the last status will be recorded if the method was called more than once during one session.
-
If in the selected period there were sessions with calls to the
$analytics.setAutomationStatusmethod:- with the
trueandfalsevalues, then the percentage is calculated using the formula:sessions with the truevalue/(sessions with the true value + sessions with the false value). Sessions in which the method was not called are not counted. - only with the
falsevalue, then the percentage is calculated using the formula:(all sessions - sessions with the false value)/all sessions. - only with the
truevalue, then the percentage is calculated using the formula:(all sessions - sessions with the true value)/all sessions.
- with the
-
If in the selected period the
$analytics.setAutomationStatusmethod was not called, the automation percentage is 100%.
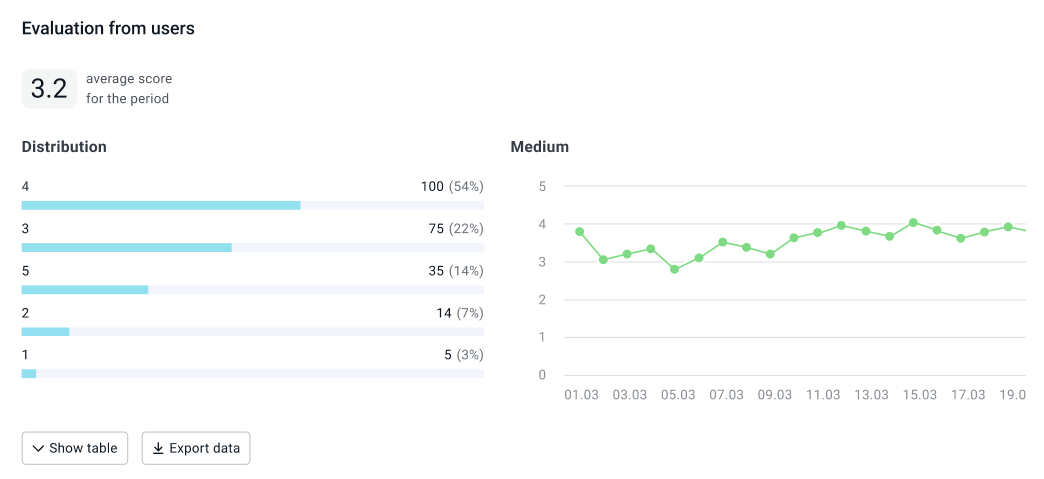
Evaluation from users
The Evaluation from users section displays statistics on the evaluations that users give in the dialog.
To collect evaluation data, mark up the script using the $analytics.setNps method.
The metrics display the average score for the selected period and the chart shows detailed data. The average evaluation is calculated as the arithmetic mean between all given evaluations. Sessions without evaluations are not counted.
The chart shows the distribution of evaluations (percentages and absolute values) in the total number of sessions, including sessions without evaluations.
Statistics on metrics
The Topics, Results, and Actions tabs display data on script metrics that you can configure in the Metrics configuration section.
The Distribution table displays the number of sessions with a certain metric and the percentage of this value out of all sessions. For example, if the session result is placing an order, and users placed an order in 20 of 100 sessions, the percentage of that result would be 20%.
You can select a specific metric value and evaluate the dynamics of its change. On the Dynamics chart you can see how many times this value was recorded for all sessions.
If the metric value was not recorded, the session falls into the appropriate category: Without topics, Without results, or Without actions. This category is displayed in the list with the rest of the values and is taken into account when calculating the percentage of all sessions.
Topics
The Topics section displays the topics on which users communicate with the bot.
How topics are recorded
Dialog topics are recorded using the $analytics.setSessionTopic method.
Several topics can be recorded within one session.
If the same topic is called by the same user within the same session,
then the value is not written again.
Results
The Results section displays the final results of the dialog with the bot. For example, a service review or order placement.
How results are recorded
Results are recorded using the $analytics.setSessionResult method.
Only one final result can be recorded within one session.
Only the last result will be recorded if the method was called more than once during one session.
You can record interim results and other actions in the dialog using the $analytics.setScenarioAction method.
It can be called several times. All values will be recorded.
To prevent results from being overwritten, end the session in the script using the $jsapi.stopSession method when the session result is set.
Actions
The Actions section displays the actions that were performed in the dialog with the bot. For example, the user left contact details, navigated to a certain state of the script, or received an SMS with additional information.
How actions are recorded
Actions are recorded using the $analytics.setScenarioAction method.
Several actions can be recorded within one session. All values will be recorded.
Data export
You can download a table with statistics on reports and charts in the XLSX format. To do this, select which data to export and click Export data.
How to use reports
| Business task example | What metrics to monitor | How to work with values |
|---|---|---|
| Track audience growth since the start of the promotional campaign. | New and returning users. | Select the period that you need using a filter and evaluate the dynamics of changes in values. |
| Reduce the number of dialogs in which the bot does not understand the user. | The total number of unrecognized messages and their number per user. | If the values are high, analyze the dialogs and phrases that fell into the noMatch event on the Dialogs tab and complete the bot’s intents. |
| Reduce agent workload in Aimychat. | Percentage of non-automated sessions. | If the percentage is high, analyze the sessions with the transfer to agent event and complete the bot’s intents. |
| Evaluate script improvements. | Average score. | Filter the values from the date the bot was last published and evaluate user satisfaction with the bot. |