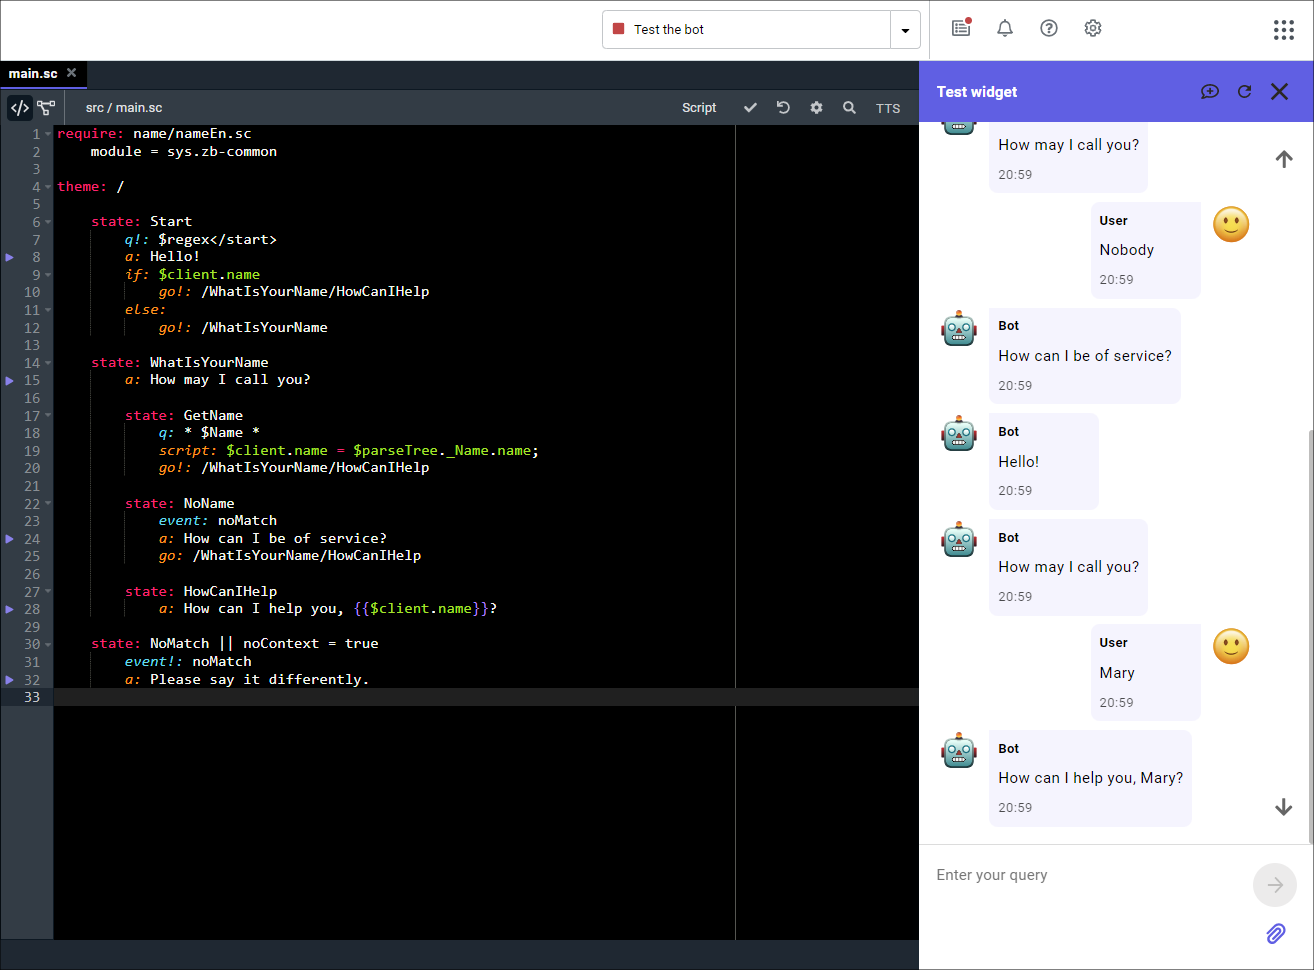
Test widget
The test widget allows testing the bot directly from the JAICP interface, without deploying it to a separate channel.
Launching the test widget
When you are within a project, click Test the bot on the top navigation bar. The test widget will be launched alongside the main JAICP interface, where you can interact with your bot before saving the changes and deploying them to a channel.

Every time you launch the test widget, the version of the bot script which gets deployed is the one which you are working on in the code editor or the J‑Graph visual editor.
Session control
Each time the widget is launched, a /start request is sent to the bot automatically.
Usually this request is handled in the state from which the bot script starts:
state: Start
    q!: $regex</start>
    a: Let’s begin.
To switch to the start state once you’ve begun testing,
you can send a /start request manually or click in the top right corner.
/start to the bot doesn’t start a new session: the conversation continues within the current one.If you want to forcibly start a new session, click . This does the following:
- If you used context switching in the previous session, the bot stack is reset.
- The following variables are cleared:
$request,$response,$session, and$temp. - A new session is started.
- The context is forcibly switched to the root theme
/. - The bot receives a
/startrequest.
Script debugging in J‑Graph
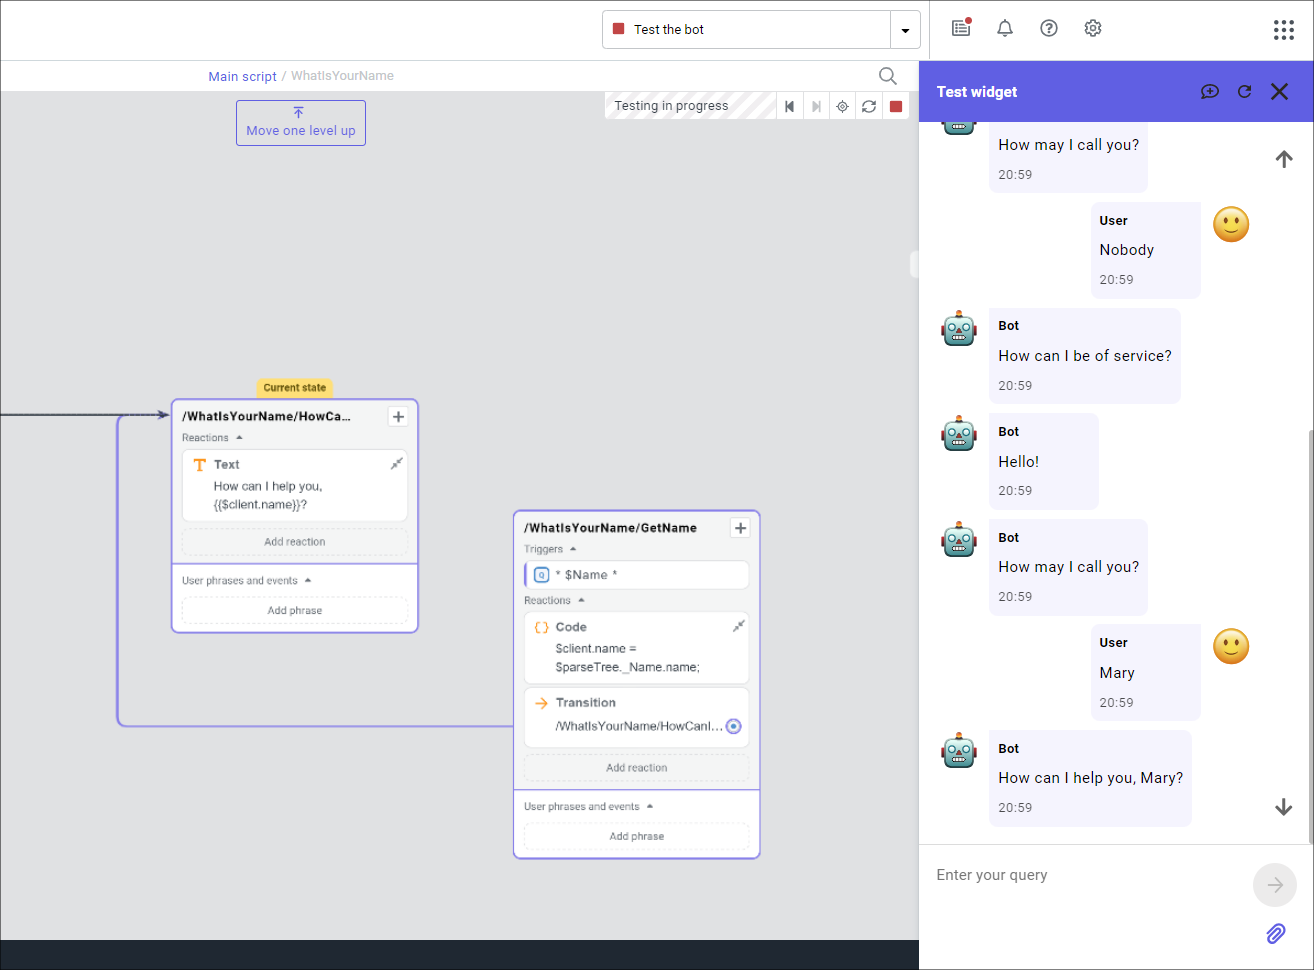
When launching the test widget at the same time as working on the script in J‑Graph, the editor switches to a special debug mode, which allows assessing visually how the dialog follows the script.
On processing each request sent to the widget in this mode, the state in the script where the request was processed is highlighted. If there were several such states, highlighting affects them all as well as the triggered transitions between them. The canvas viewport centers around the state triggered last.
