Volumes
The Volumes section displays aggregated project statistics on clients, dialogs, and messages.
As soon as the message traffic starts, charts on the number of clients, messages, and dialogs will appear. In addition, you can set up filters and compare statistics between the specified periods.
Charts
Here you can see the volumes on the number of clients, messages, and dialogs represented as a chart. They can be displayed hourly, daily, weekly, or monthly.
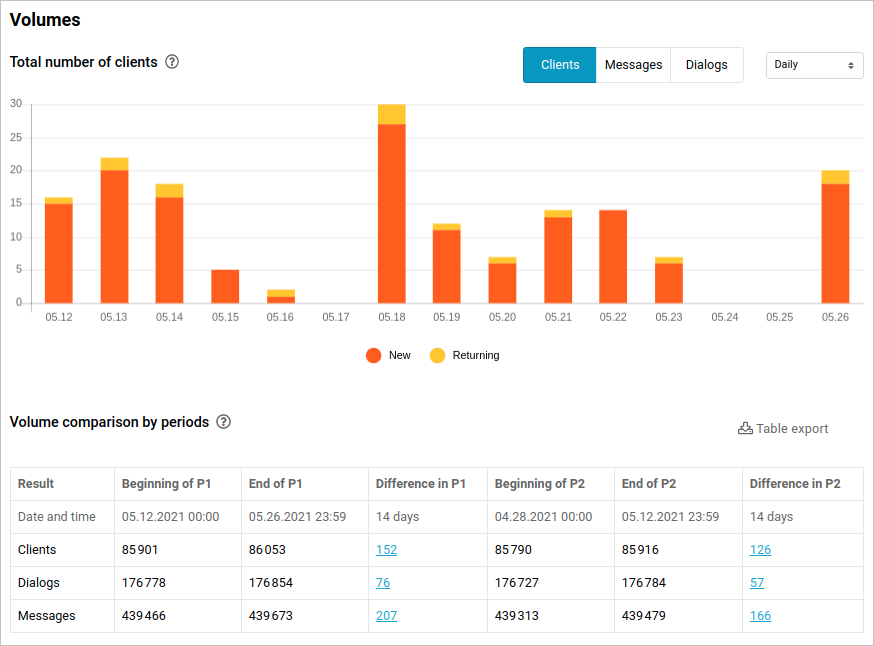
Total number of clients
On the chart you can:
- See the total number of clients.
- Analyze the clients’ growth.
- Compare the number of new and returning clients.
The following switches are displayed under the chart:
- New — clients who only talked to the bot once.
- Returning — clients who talked to the bot at least twice.
Total number of messages
Click on Messages. The chart illustrates the ratio of recognized and unrecognized messages.
- Recognized — messages that the bot could recognize. Empty and
/startmessages do not count. - Unrecognized — messages that the bot couldn’t recognize. The bot response to such messages is configured in the Settings → In case any problems occur section.
- System —
/startmessages.
Total number of dialogs
The chart illustrates the ratio of dialogs that were and were not empty.
- Empty — a dialog that does not contain any messages from the client.
- Not empty — a dialog that contains text input or any file from the client. The
/startmessages do not count.
Period comparison by volumes
The table contains the following metrics: the number of clients, dialogs, and messages at the beginning and at the end of P1 and P2. This way you can assess your bot’s popularity dynamics.
Table export
To export the table in the .xlsx format click the Table export button.